Timing tab
The Timing tab displays a packet timing graph of all the packets in the selected request row or rows. This tab lets you view all of the requests of a web page simultaneously, across multiple flows, multiple servers, and through time. You can view a complete HTML page load from start to finish, within a single graph, with packet-level precision.
For examples of how to read the information displayed in the Timing tab, see Timing example of single request and Timing example of multiple requests.
The parts of the Timing tab display are described below.
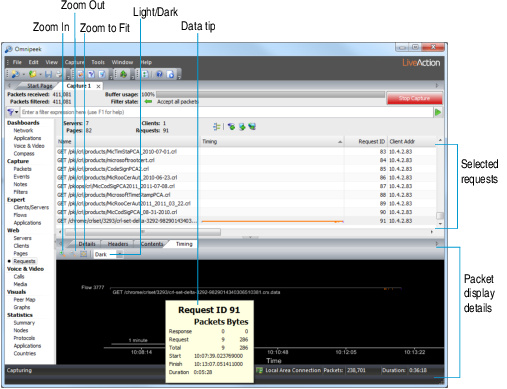
• Zoom In: Click and drag a rectangle across the portion you want to see to zoom into a specific portion of the graph.
• Zoom Out: Click to decrease the display of the packet timing graph.
• Zoom to Fit:Click to render the entire packet timing graph within the available screen space.
• Light/Dark: Choose a light or dark background color for the packet timing graph display.
• Data tip: Hold the cursor over a point on the packet timing graph to view a data tip displaying payload size, relative time, number of requests and responses.
• Packet display details:
• Client request packets appear below the grey packet timing graph.
• Server response packets appear above the grey packet timing graph.
• The size of packets are indicated by the size of the tick marks. Larger tick marks indicate larger packets.
• Different packet colors identify TCP flags, HTTP warnings and errors, client and server packets.
• Reference bars at the bottom of the graph give a rough sense of scale.
NOTE: HTTP timing graphs share the same tools with Flow Visualizer graphs. (See Flow Visualizer.) You can drag a rectangle to zoom, change colors to light or dark, and use the SHIFT or CAPSLOCK key to show a magnifier view of the graph.
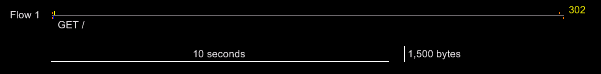
Timing example of single request
Flow 1 in the following example contains a single request to http://liveaction.com.
To view this flow:
• Select http://www.liveaction.com in the upper pane of the Web view window.
• An initial pair of orange SYN packets starts this flow, one below the packet timing graph from the client, and one above the packet timing graph from the server. These are flag-only packets, since they do not touch the grey horizontal packet timing graph.
• The SYN connection packets are immediately followed by a single blue request packet below the packet timing graph: the request to GET /. The server immediately responds with a yellow warning packet (yellow packets are HTTP 300-399 warning responses). The 302 indicates that the page was found, but at a different location. The browser is therefore being redirected to http://www.liveaction.com.
NOTE: If this were an HTTP 400+ error such as 404 Page not found, the packet and number would appear in red.
• The connection stays open, though idle, for about 15 seconds (1.5 times the length of the 10 seconds reference bar). A pair of FIN packets then close the TCP connection.
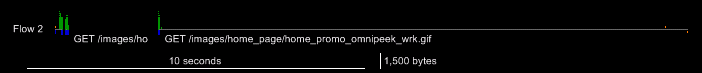
Timing example of multiple requests
Flow 2 in this example contains multiple consecutive requests, starting with http://liveaction.com:
To view this flow:
1. Select http://www.liveaction.com in the upper pane of the Web view window.
• The client’s initial SYN packet is obscured by the first blue request packet, but the server’s SYN response is clearly visible. A blue client request packet is followed by several green response packets. The green response packets are probably maximum size, since they are close in height to the 1500 bytes reference bar.
• The cluster of green packets has additional green dots over the packets, indicating that multiple packets occupy the same screen pixel. One dot indicates one additional packet, two dots for two packets, and three dots for three or more additional packets. There are many of green packets here, indicating that this is a sizeable response. If you hold the mouse over the green packets, a tooltip shows that Request ID 2 squeezes 39 response packets and 45KB into that tiny space.
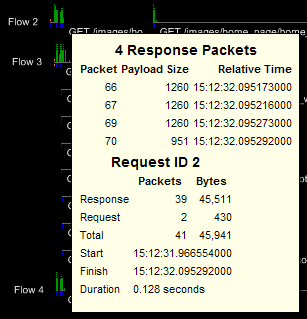
2. Zoom in to see that there are actually 18 complete request/response sequences in the first 20 pixels of horizontal space. Drag a rectangle around the cluster of packets to view the following image:
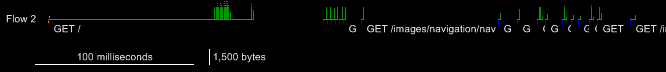
It is now possible to see the initial query and its many large response packets, then a series of six tiny requests, each with a short response that fits in a single packet. Eventually more queries fire, with different idle periods between them. You can also see that the time scale has changed, and that a 100 milliseconds reference bar shows that this entire sequence takes less than around 500 milliseconds.
NOTE: All of these request/responses happen on a single horizontal packet timing graph. This implies that the browser never queues up the next request until the previous response completes.